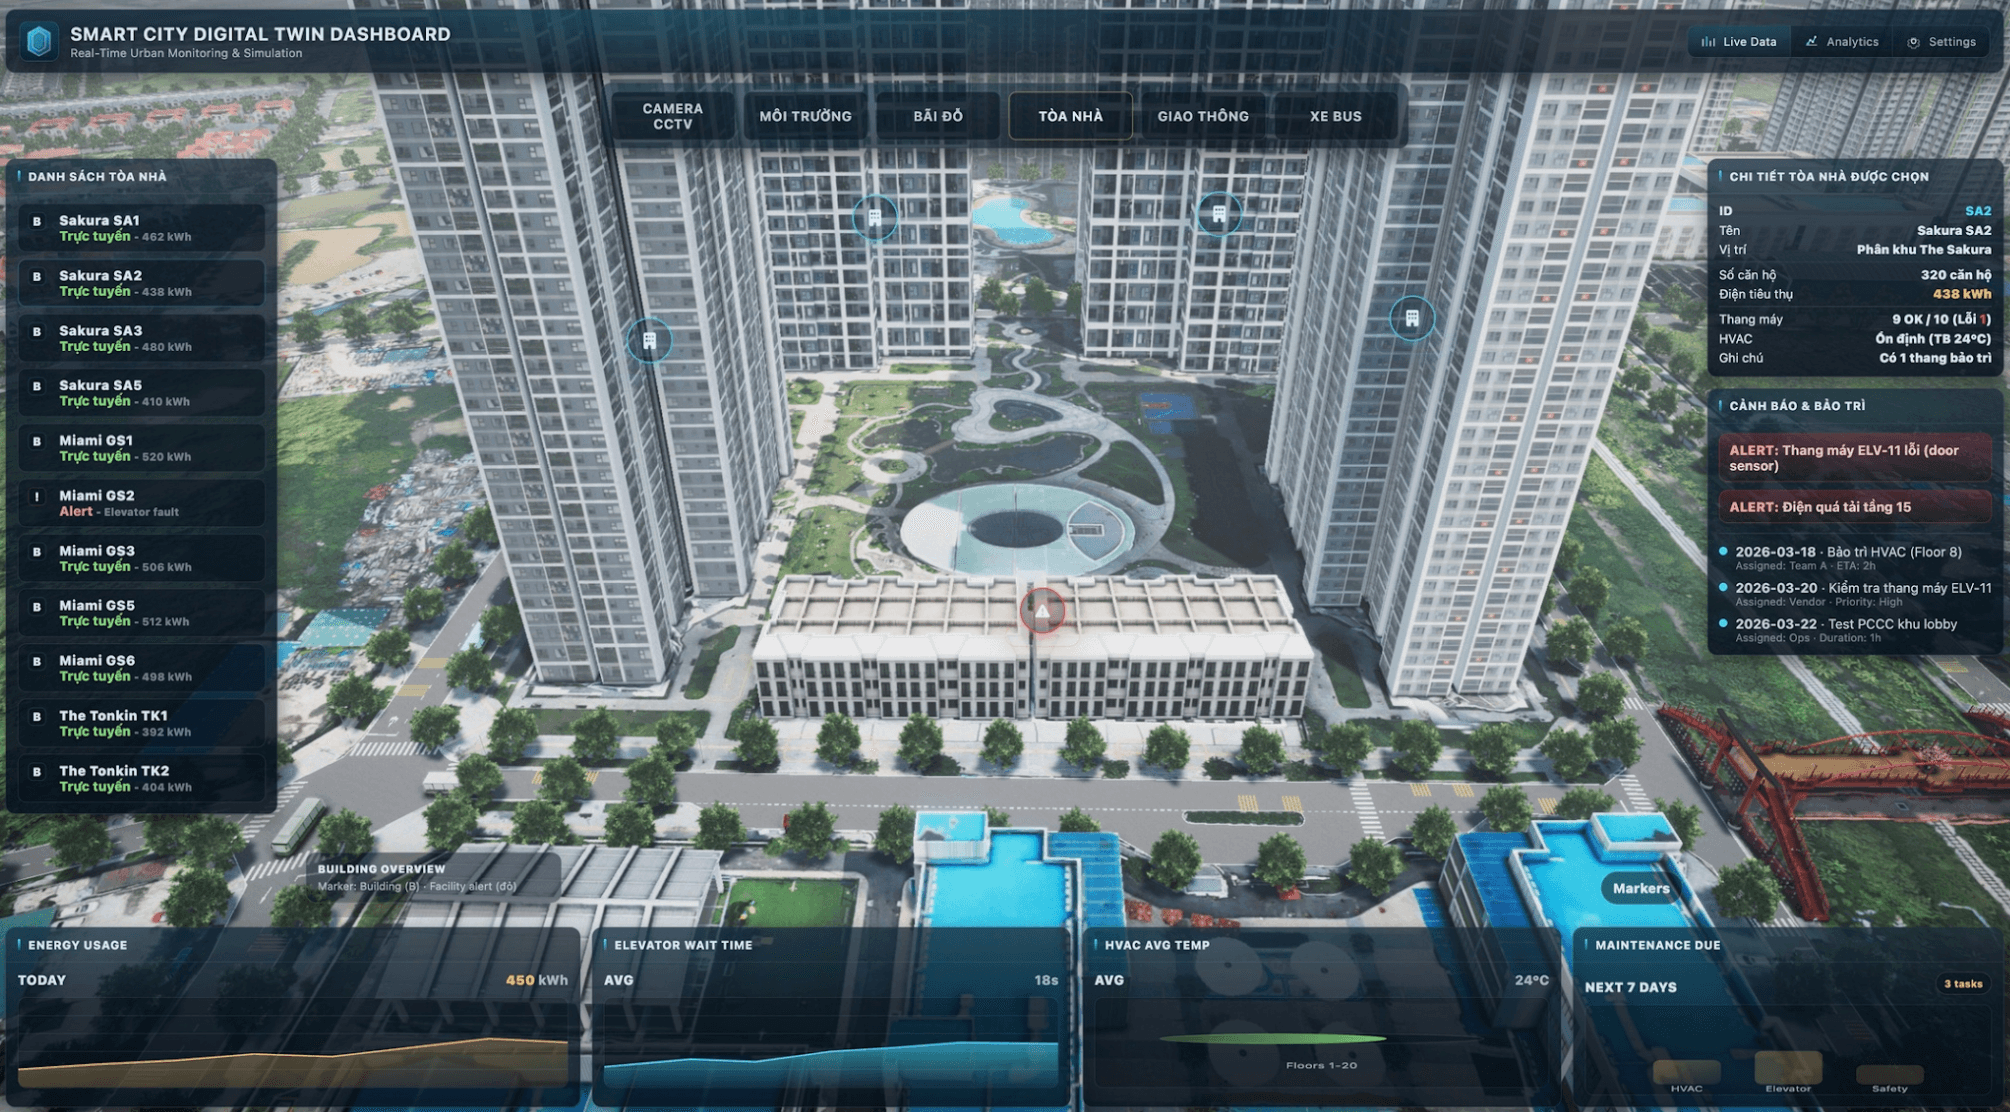
What’s so ‘special’ about a 3D urban model and how to exploit it to create value?
In Part 1, we looked at the Urban Digital Twin from the foundation of ‘digital maps and GIS’: a city in the digital world composed of multiple data layers, and GIS helps us layer, query, measure, and analyze spatially. In Part 2, the story takes a more important step: a 3D urban model not only gives maps ‘height’ but also carries a data structure rich enough to simulate, infer, and make decisions. In other words, if GIS is the ‘workbench’ for spatial data, then a 3D model is the ‘material’ that determines how much you can achieve.
The interesting point is: a true 3D urban model is usually not evaluated by the question ‘does it look real?’, but by the question ‘what can be calculated from it?‘. Therefore, to understand and scientifically implement an Urban Digital Twin, we need to grasp three main layers of meaning: (1) what ‘information components’ a 3D model consists of, (2) how different Levels of Detail (LOD) lead to different exploitation capabilities, and (3) whether data should be used directly or needs to be extracted and converted to suit the implementation tools.
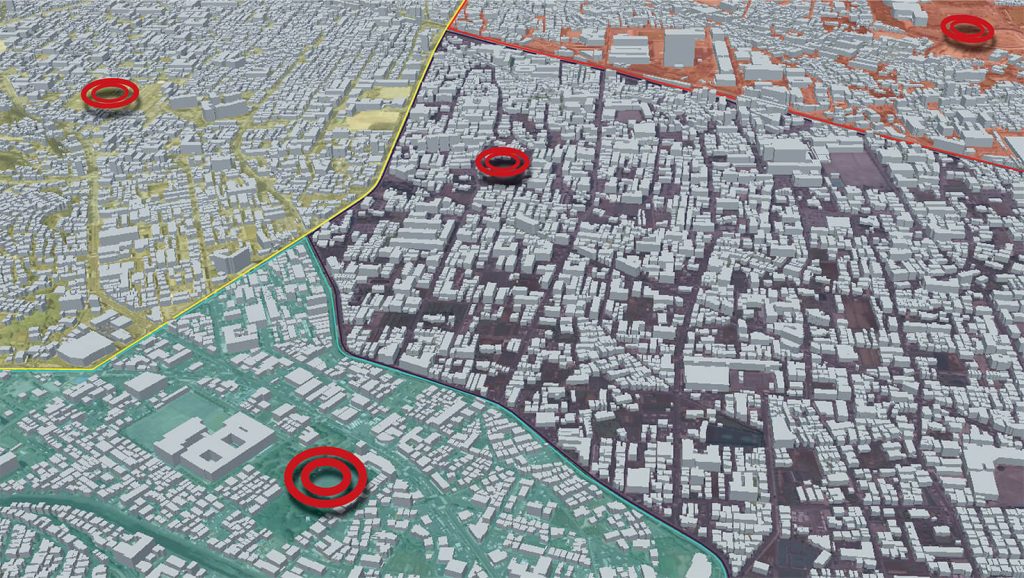
Hypothetical scenarios are the quickest way to check: is the data good enough for simulation and decision-making?
1) Why a 3D urban model is not just a 3D image: ‘geometry’ + ‘semantics’
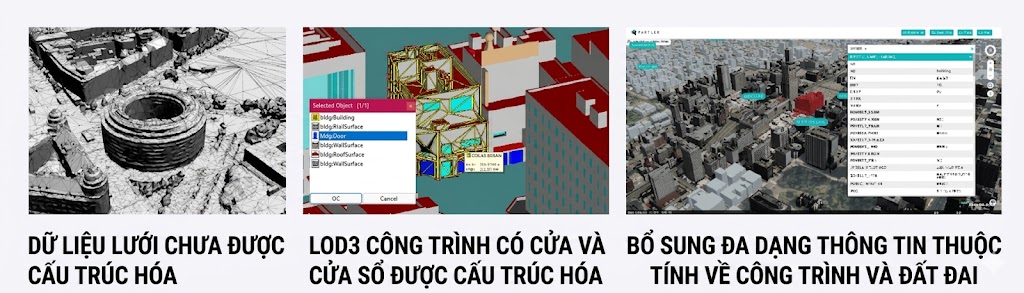
A Digital Twin is not just a ‘3D image’, but a 3D image + structure + attributes for filtering, calculating, and simulating
In a modern approach, a 3D urban model is often described as an integrated model between geometry and semantics/attributes. Geometry answers ‘where an object is located and what its shape is’, while semantics answers ‘what an object is and what its characteristics are’—for example, type of landmark, function, structure, year of construction, etc. The important point is that attributes are not just attached to ‘the entire building’, but can be attached to individual surfaces (roof, wall, floor, etc.), so the model becomes a data system that can be filtered, aggregated, and calculated according to the problem’s context.
From a Digital Twin perspective, this is a pivotal shift. Because without semantics, a 3D model is just like a ‘statue’: visible but difficult to infer from. Conversely, when geometry is accompanied by semantics, the 3D model becomes a ‘data map’: you can ask conditional questions (filter by attributes), statistical grouping, and especially, it can be integrated into scenario-based simulation models.
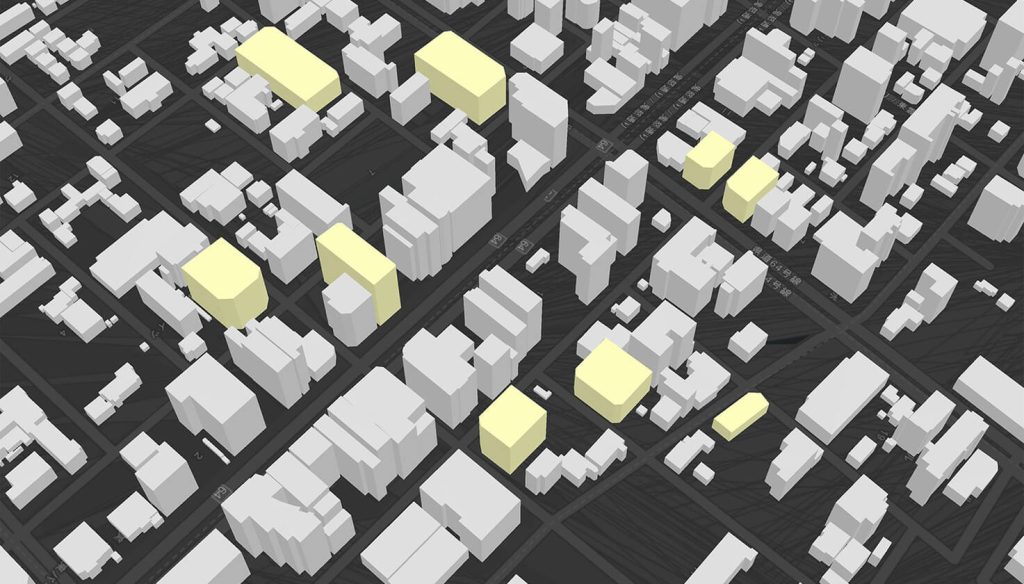
When objects have ID & attributes, you can ‘highlight’ the specific group of interest instead of seeing the entire city as a single block
2) LOD (Level of Detail): the same city, multiple levels of detail – and multiple usage goals
LOD is a concept that describes the level of detail of a 3D model. For buildings, the LOD system typically ranges from a very coarse level (only 2D footprints or no height) to a level with ‘block-like’ height, then to a level clearly showing roofs, walls, and exterior protrusions; even higher levels can describe windows, doors, bridge intersections; and the highest level can include the interior spaces of the building.
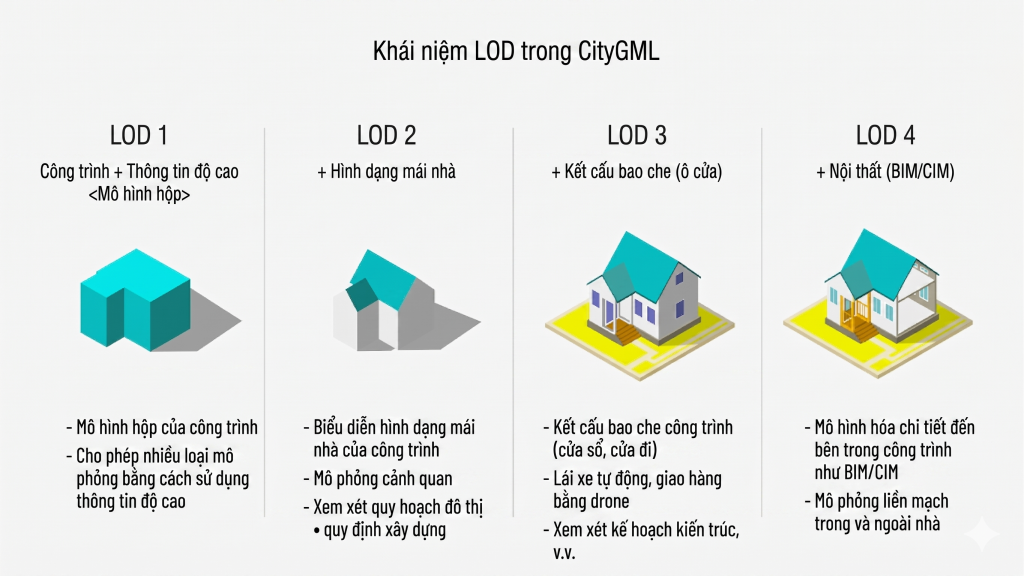
LOD is the level of detail of the model: the higher, the more can be done, but the more effort and data-intensive it becomes
What’s worth remembering is not to memorize each level’s name, but to understand the underlying technical logic: the higher the LOD, the ‘costlier’ the model is to create and the ‘heavier’ it is to process, but at the same time, it unlocks more problem-solving capabilities. Therefore, smart implementation often doesn’t aim for the ‘highest LOD for the entire city’, but rather for ‘just enough LOD for the right objective’: areas requiring detailed risk analysis prioritize detail, while areas only needing a general overview use a simpler level to save computational and operational costs.
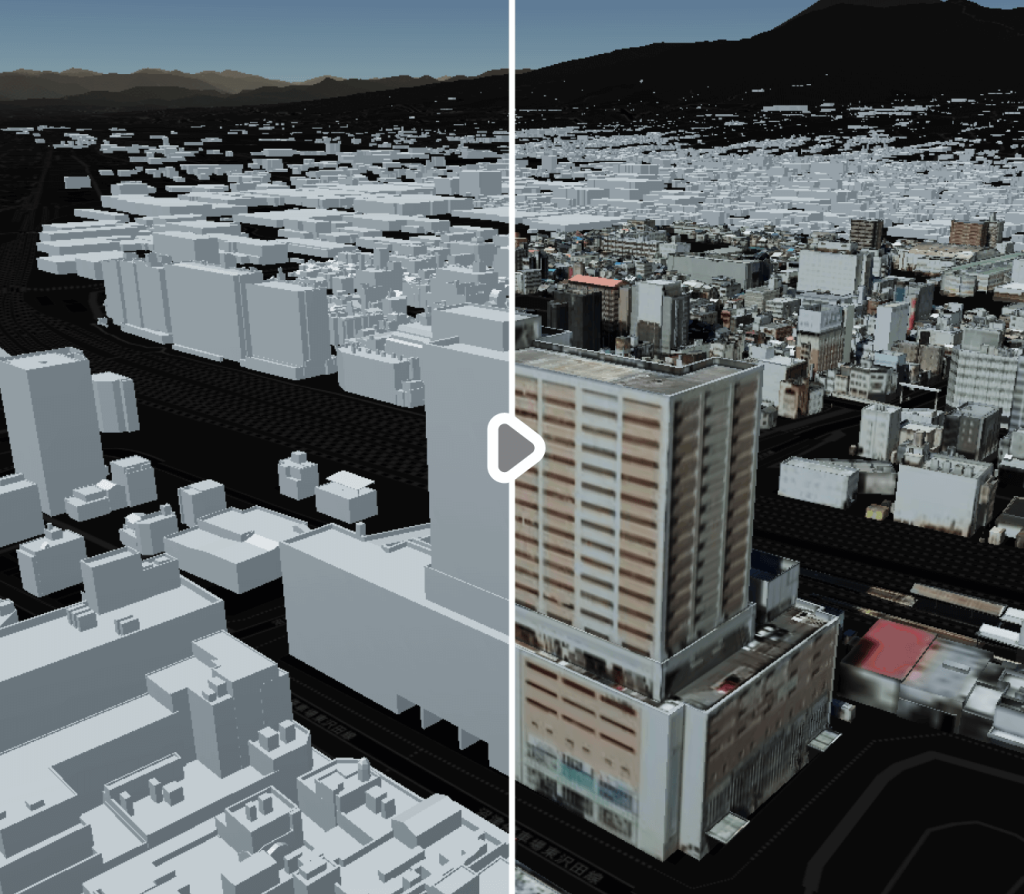
Low LOD is still very useful for statistics, general planning, and large-scale simulation
Another subtle point is that the data structure can store multiple LODs in parallel for the same object (multi-scale data). In this case, the system can display and calculate at various levels of detail depending on the context: view the entire city at a light level, then ‘zoom in’ on an area of interest at a detailed level for analysis.
3) ‘More information’ means ‘more calculability’: from roof area to evacuation simulation
The difference between LODs is not just in the visible shape, but also in the amount of semantics that the model carries. For example, when the model can distinguish between roof-wall-floor surfaces, you can reliably aggregate ‘roof area’ to estimate solar power potential or evaluate heat-absorbing surfaces. And when the model defines ‘openings’ such as doors and entrances, it opens up problems related to pathways, accessibility, and simulating movement behavior in space.
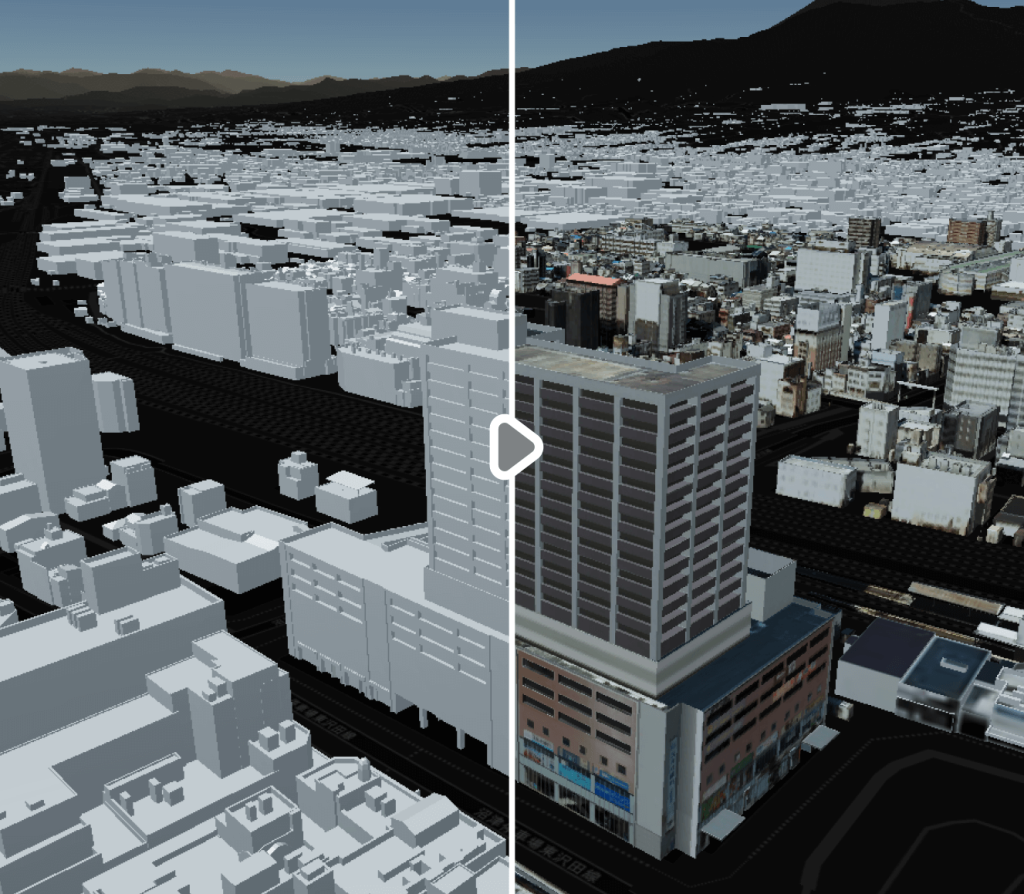
The right details in the right place help make simulations more realistic, leading to more reliable results
Similarly, for transportation infrastructure, when data can distinguish between vehicle lanes and pedestrian paths, or describe elevation differences, intersections, or even lane separation, then traffic simulations or safety analyses will have a more ‘fundamentally correct’ data foundation. Here, a scientific yet very practical principle emerges: the more accurately a Digital Twin aims to predict, the more ‘correct type’ the input data must be. Adding detail is not for embellishment, but to reduce model mismatch between the digital world and the real world.
4) Exploiting 3D models in 4 common directions: Simulation, GIS, content (VR/AR), and on-demand conversion
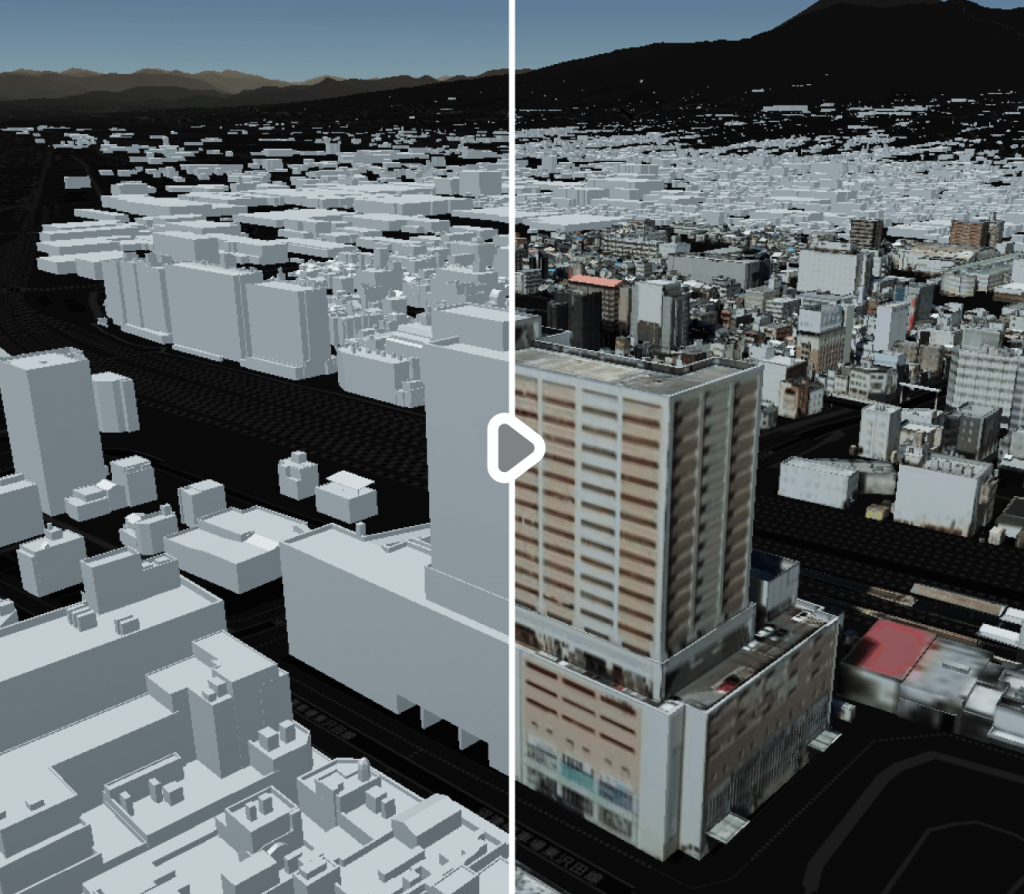
It’s not always about ‘photorealism’. What’s important is the right level of detail for the right task
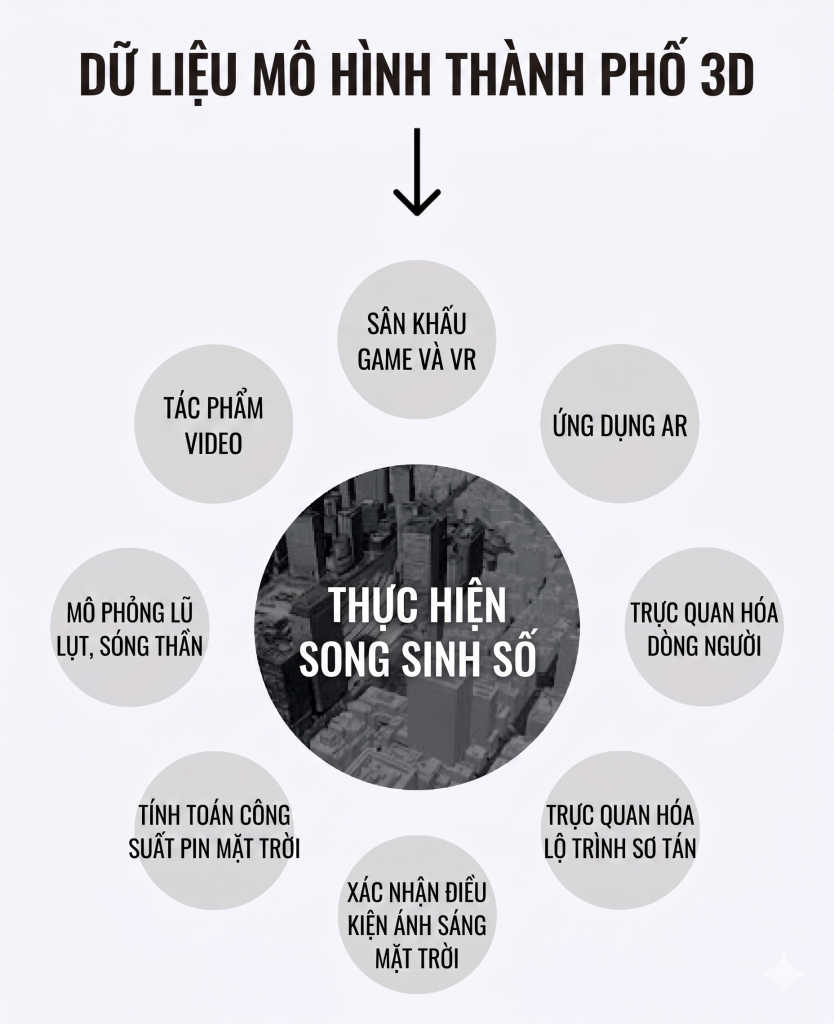
Firstly, 3D urban models can serve as a foundation for large-scale urban simulation. With 3D geometry and attributes already in place, you can integrate additional population data, transportation networks, and environmental data to simulate urban futures; or simulate water-heat-wind (CFD), crowd movement, solar power, and even wave propagation. The valuable point is: when simulation is directly integrated into attributes (year of construction, number of floors, structure, risk level, etc.), the results can shift from ‘intuitive’ to ‘quantifying risk’, meaning they can answer who is affected and how.
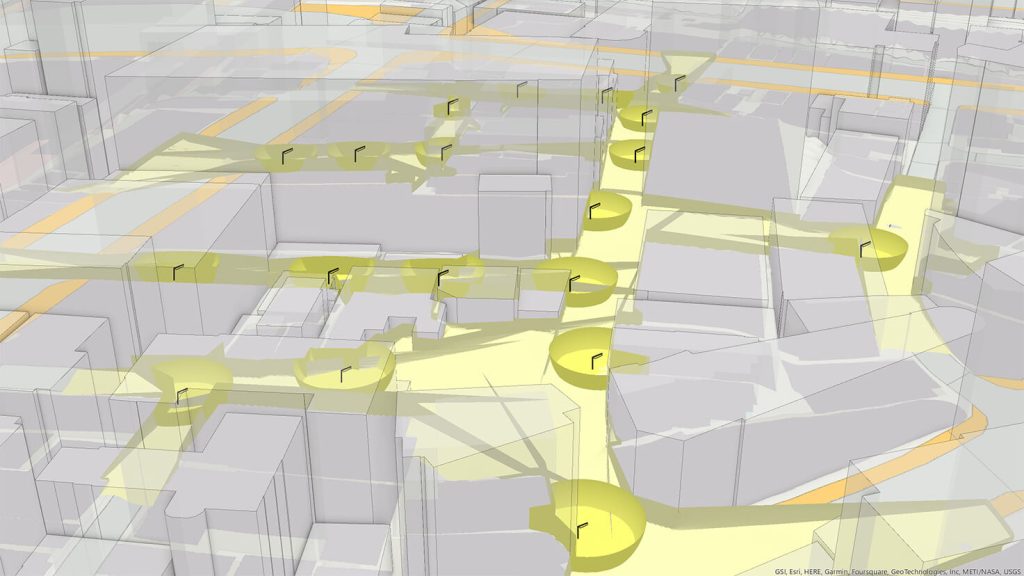
3D + attributes enable very realistic simulations: lighting, visibility, urban safety… (Simulating street light illumination levels)
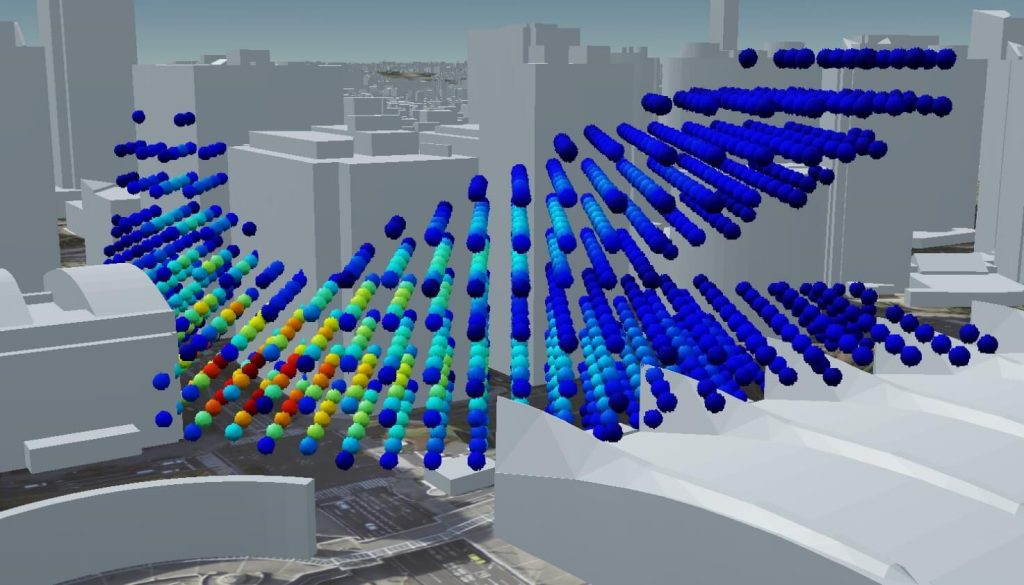
3D models help simulate wave propagation/dead spots—very useful for telecommunications and IoT
Secondly, 3D models can be used as a type of 3D GIS data: layering statistics, traffic data, and risk data for visualization and spatial analysis. When transitioning from 2D to 3D, you gain analytical capabilities that are difficult to perform well in 2D, such as visibility analysis (seeing from where), or assessing the impact of development/redevelopment plans on traffic and population.
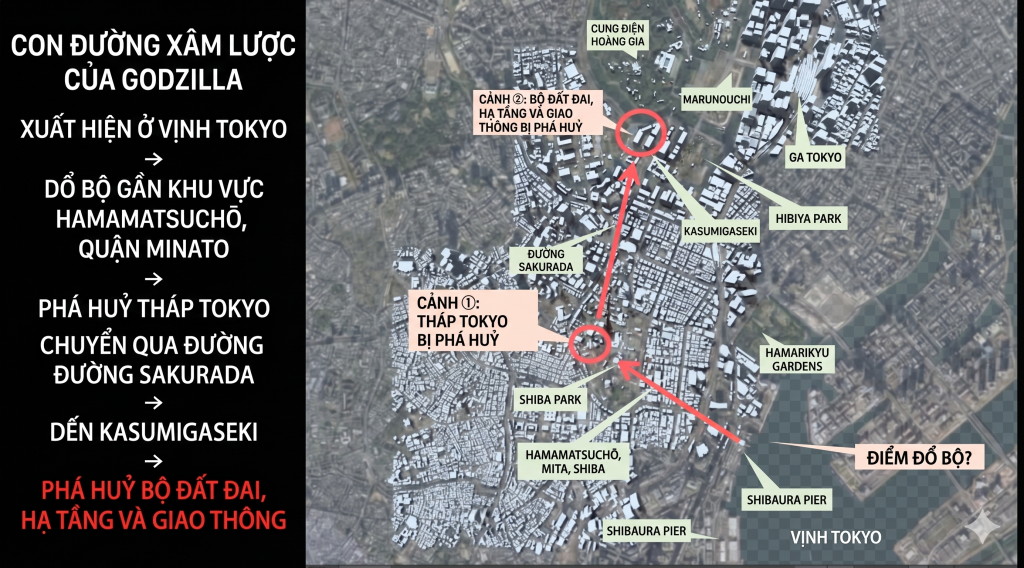
Overlaying risk layers on 3D to identify ‘hot spots’ and prioritize intervention – Simulating a Godzilla invasion
Thirdly, 3D models can become the ‘stage’ for games, VR, AR, and content production. The reason is not only because it is detailed, but also because the shape is accurately described and linked to latitude and longitude, making it easier to ‘overlay’ digital content onto the real world—especially in AR.
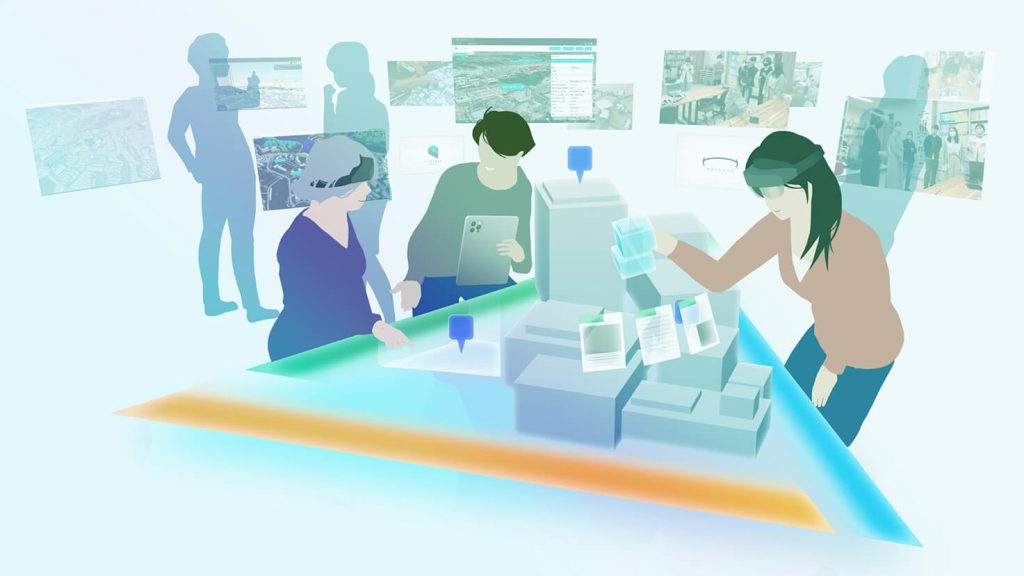
When everyone ‘sees’ the urban future on a digital model, discussions and consensus become easier
Fourthly, and also a very common practical implementation: not using all data, but extracting the necessary parts and then converting them to a format suitable for the tools. Many urban 3D model datasets are described using CityGML (an XML format extended from GML for describing map data), which is suitable for exchange and standardization, but not all software can process it directly with ease. Therefore, the common process is ‘extract–process–convert’: take the correct layer, correct area, correct LOD, then convert to the format that the system is using (GIS engine, game engine, simulation tool…).
Conclusion: Part 2 helps us understand how to use 3D models to truly become a Digital Twin
If Part 1 gave us the foundational language of digital maps and GIS, then Part 2 helps us understand the most important ‘material’ of an Urban Digital Twin: a 3D model is not just an image, but structured data; LOD is not just an aesthetic level, but a capability level; and semantics are not just for description, but for calculation and simulation. When you connect these three ideas, you will avoid two common extremes: 1 – building beautiful 3D models that cannot be analyzed, and 2 – trying to simulate extensively but having data that is not of the right type for reliable results.
Therefore, a wise implementation approach usually starts from the use case, selects the appropriate LOD, attaches the correct important attribute layers, and then designs an extraction-conversion process to feed the data into the right tools. From that foundation, a Digital Twin gradually evolves into a sustainable decision-making system rather than just a ‘3D model to look at’.
_When you need a Digital Twin – You just need to contact MH&T_