Foundations for Understanding Urban Digital Twins: Digital Maps, GIS, and 3D Urban Models
When people mention digital twins, they are often captivated by ‘lifelike’ 3D images. However, focusing solely on the visual aspect is merely touching the surface, not the essence. This is because digital twins, especially in an urban context, are about structured data, measurement and analysis, and the ability to transform a complex city into something understandable, verifiable, even simulatable and predictable. To achieve that level, we need to start with two seemingly ‘old’ but ultimately decisive foundations: digital maps and GIS (Geographic Information System) .
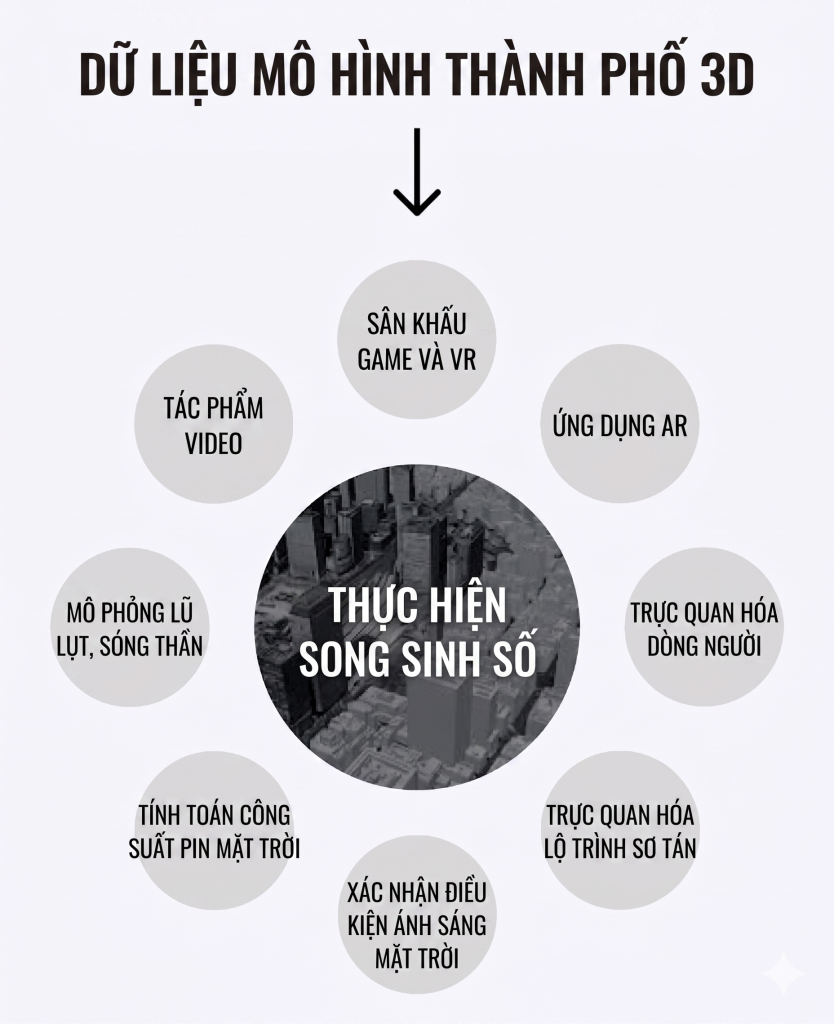
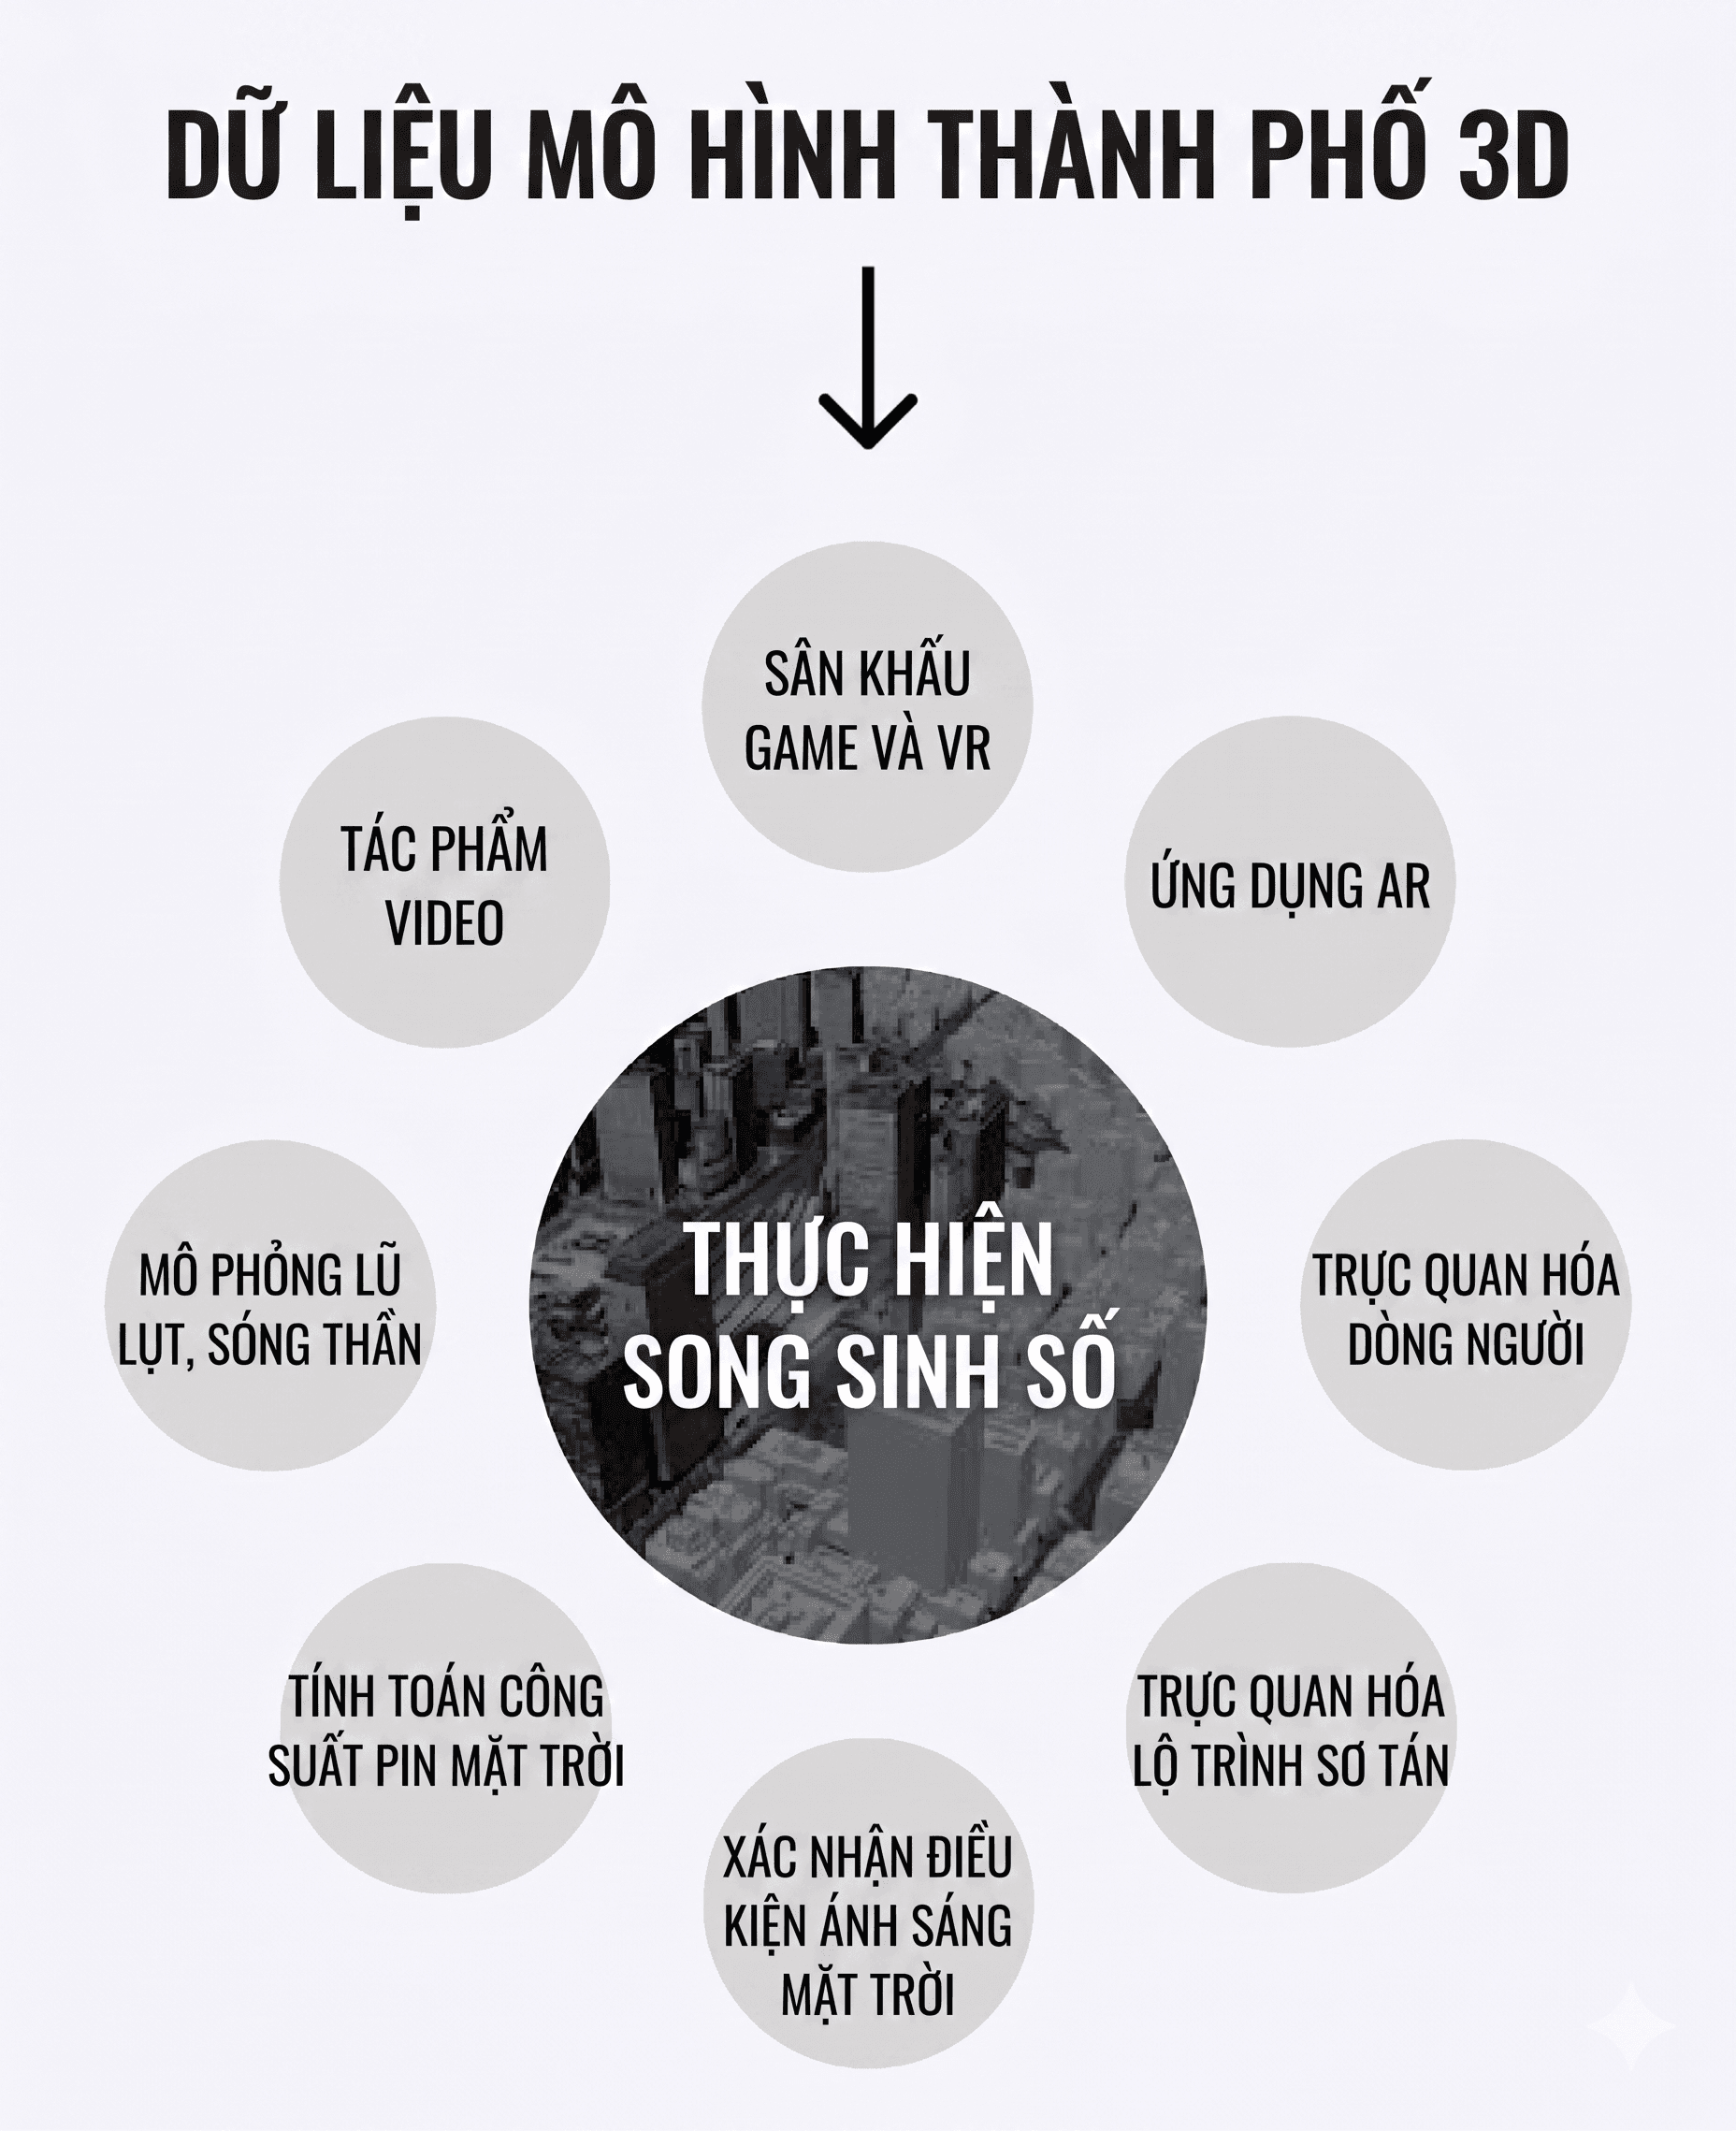
3D urban datasets can ‘solve’ many problems, from risk simulation to AR/VR and operational optimization
In summary, a digital map is not just a ‘map on a computer’ but a way to represent the world using spatial data. And GIS is not just a tool to view maps, but a ‘tool’ to organize, layer, query, and analyze data based on location information. When these two elements combine with 3D urban models, we will have a powerful enough foundation to systematically deploy urban digital twin applications, from current state visualization to risk analysis, from regional statistics to scenario simulation.
3D Urban Models: When Digital Maps ‘Elevate’ in Height
A 3D urban model can be understood as a type of 3D digital map . It recreates urban space as data, with position and size described according to specific quality standards. Therefore, 3D models here are not only useful for ‘visual purposes’ but also for ‘accuracy purposes’. If shapes and sizes are accurate enough, that data can be used in situations requiring metrics (measurement, impact range analysis, or performing error-sensitive simulations (e.g., flood simulation or risk simulation)).
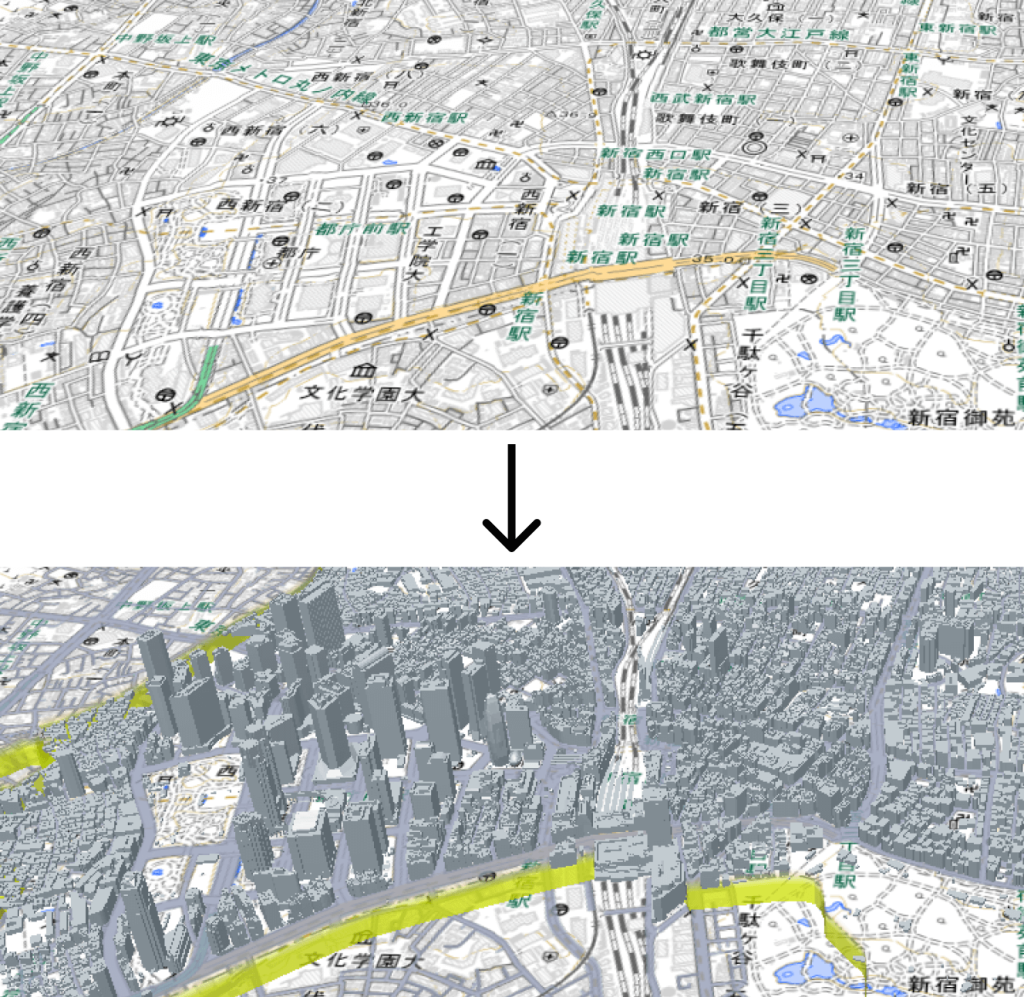
More importantly, a ‘data-driven’ 3D urban model can often include not only buildings but also roads, terrain, planning zones, land use layers, disaster risk areas, and many other urban infrastructure layers. When these layers exist as stackable data, the city in digital space is no longer a ‘landscape’ but becomes an analyzable system.
Digital Maps are Created by Layering — GIS is the Tool for Layering
The biggest difference between paper maps and digital maps lies in how they are ‘packaged’. Paper maps often merge various types of information onto a single plane. In contrast, digital maps are created by stacking multiple layers of geospatial information depending on the purpose. And GIS is precisely the tool that allows this layering to be done flexibly.
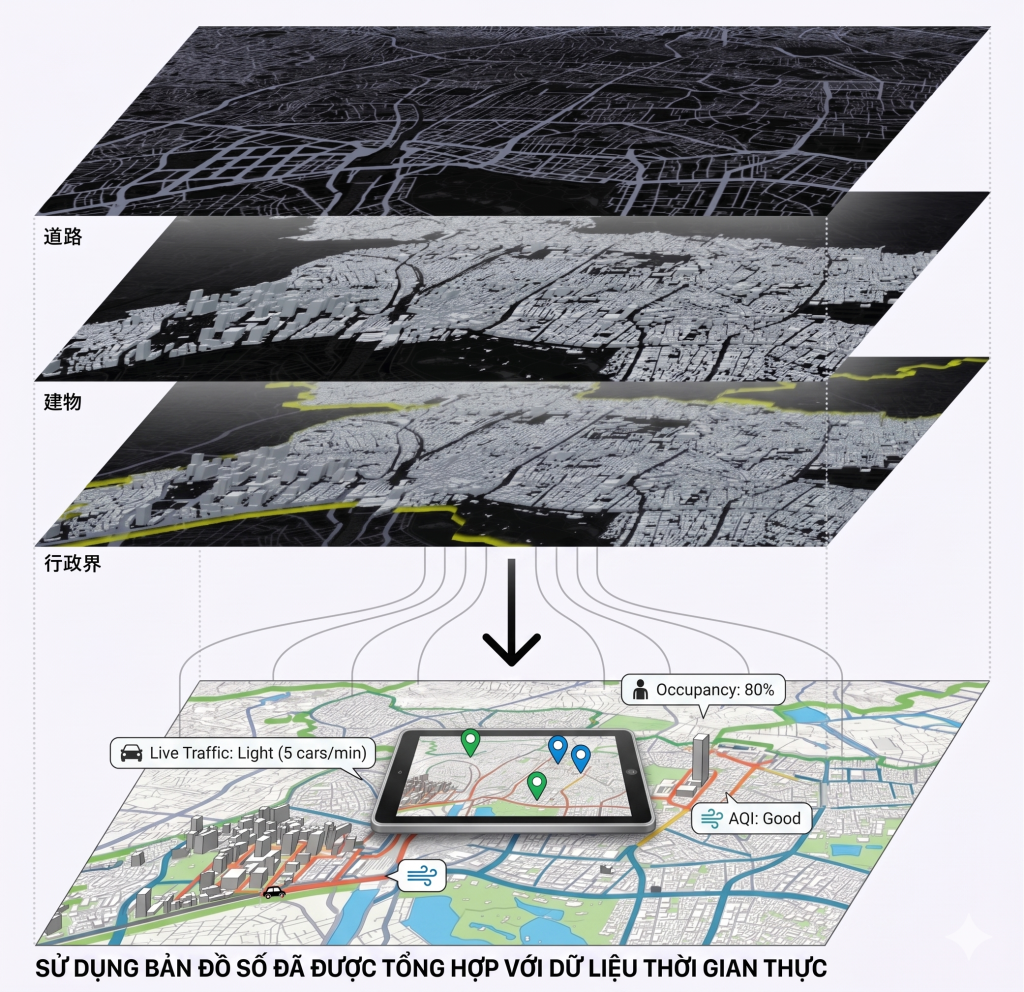
Thanks to GIS, we can use the building layer to understand building structures, the road layer to understand accessibility, the planning area layer to understand legal restrictions, and add the disaster risk layer to understand vulnerability levels. If different perspectives are needed, simply changing the combination of data layers can create multiple ‘thematic maps’ from the same ‘data city’.
To visualize easily, GIS is like an assembly table, where each data layer is a transparent puzzle piece. You can put in what’s needed, remove what’s not, and most importantly, you can not only display these pieces but also perform calculations.
Basemaps: The Foundation Layer that Helps Readers Understand ‘Where They Are’
No matter how accurate building data is, without context, viewers can easily get lost. Which district is this, which road, where are the administrative boundaries? Therefore, in GIS, basemaps are often used as a foundational layer to provide context such as administrative boundaries, place names, or satellite/aerial imagery.
It’s worth noting that there is no ‘one-size-fits-all standard option’ for basemaps. Depending on the purpose, you can use background data provided by government agencies, open-source maps like OpenStreetMap, or satellite imagery depending on the ‘level of real-world relevance’ required.
Technically, basemaps often come with common GIS formats and mechanisms (e.g., imagery with embedded coordinate information (GeoTIFF), orthorectified imagery (orthophoto), or ’tile’ maps (XYZ tiles) loaded as needed by area). These details are not meant to confuse beginners, but to remind that digital maps are not just simple images, but images linked to a spatial reference system, allowing them to ‘match’ when stacking multiple data sources.
GIS as an Analytical Tool: When ‘Invisible’ Data Becomes Tangible and Measurable
A common misconception is to view GIS as ‘map creation’ software. In reality, GIS demonstrates its true value when it functions as an analytical tool. This is because in urban management, many important things are ‘invisible to the naked eye’. Examples include planning zones, landslide risk areas, anticipated flood zones, shelters, population distribution, or regional statistical layers. When these layers are converted into spatial data and stacked, a new capability emerges: analysis based on location information.
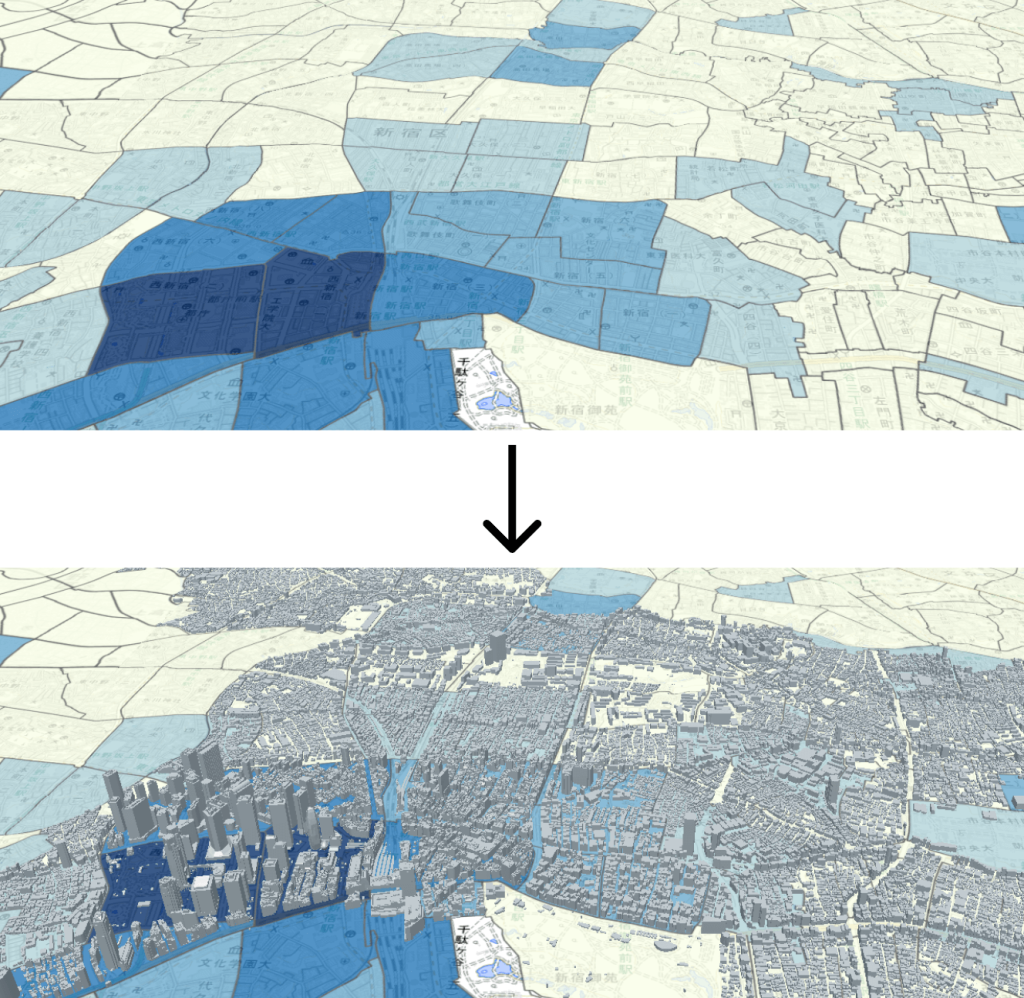
GIS also allows ‘off-map’ data to be brought onto the map. If coordinates and values (e.g., electricity consumption, number of incidents, environmental indices, etc.) are available, you can assign them to space to look for patterns. And even if data only has addresses or place names, you can still use geocoding to convert them into coordinates before analysis. From a digital twin perspective, this is the step of transforming disparate operational data into a spatially structured picture, which is a prerequisite for simulation and decision-making.
Objects and Attributes: Why 3D Data is Not Just ‘Displayed’ but Also ‘Understood’
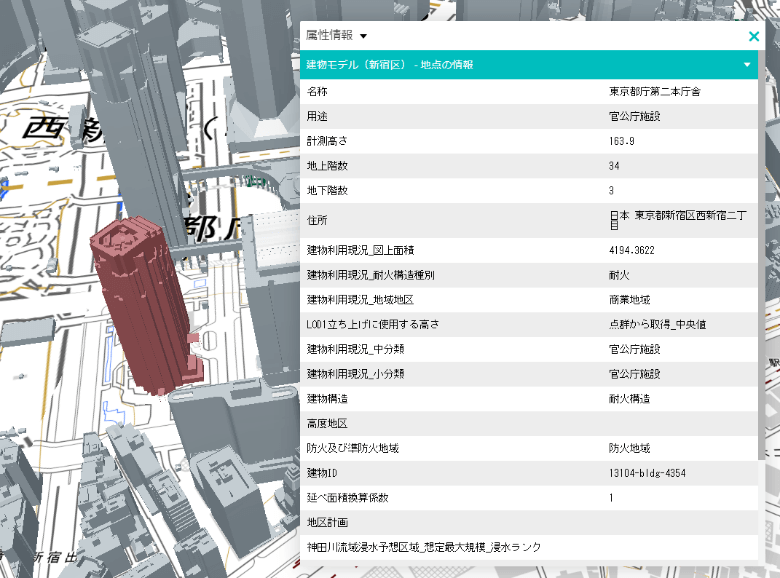
To properly understand GIS, we need to grasp two important concepts: features and attributes . Features are any entities represented on a map, including not only buildings, roads, terrain, but also administrative boundaries or risk areas with administrative significance, even if not directly visible to the naked eye.
Each feature consists of a ‘geometric’ part and an ‘informational’ part. The ‘geometric’ part tells us where it is and what shape it has, while the ‘informational’ part describes what it is and its characteristics (name, height, function, structure, number of floors, etc.). It is this attribute layer that helps 3D data go beyond a visual role to become analytical data. This allows us to not only see building blocks but also filter groups of buildings based on criteria, generate regional statistics, or integrate them into simulation models.
Vector and Raster: The Two ‘Languages’ of Spatial Data
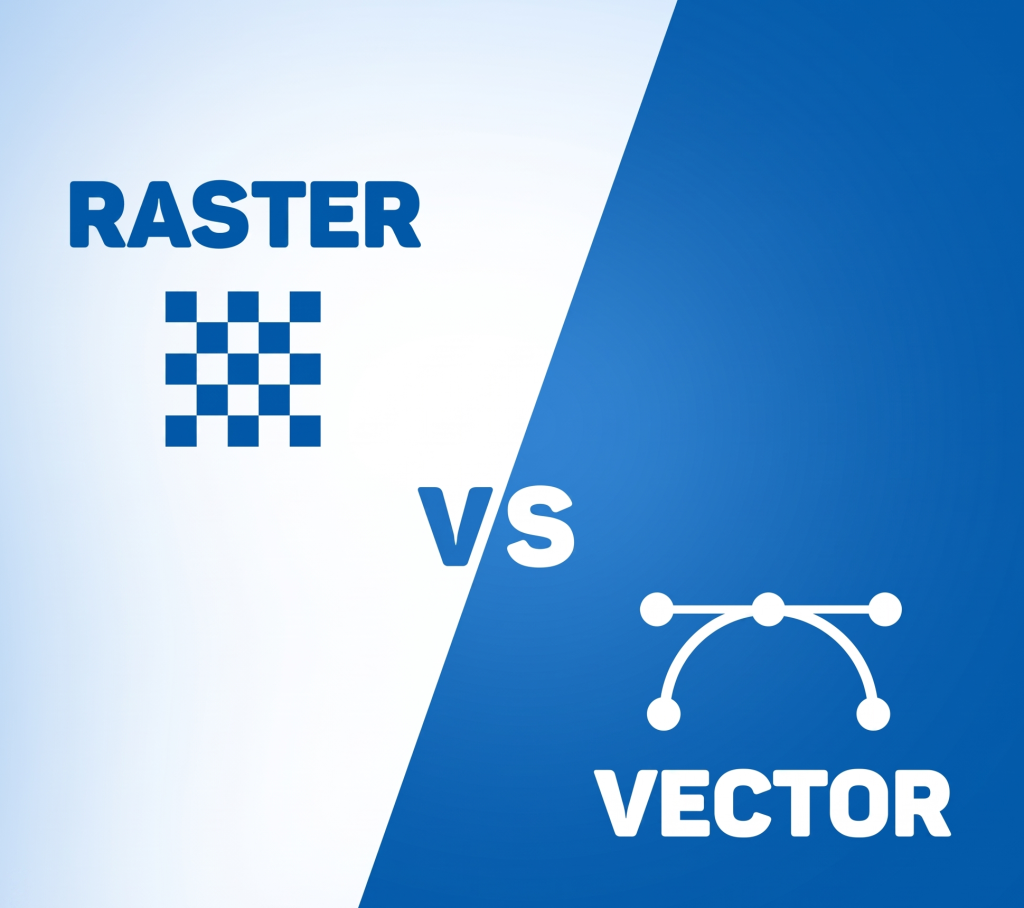
At the data level, GIS primarily handles two formats: vector and raster . Vector uses geometries such as points, lines, polygons, and (in a 3D context) blocks to describe the world. By storing geometries, vector excels in spatial calculations. It can search for objects within a specific radius, measure area, check for intersections, or query by region. At the same time, because it only stores vertices and geometric relationships, it is often more storage-efficient than image storage.
Raster is image-based (pixel) data with embedded coordinate information, typically satellite or aerial imagery. Raster is very intuitive, but its detail depends on its resolution. Furthermore, since it does not store geometry as vertices or edges, it is not strong in geometric operations such as ‘measure-cut-combine’ like vector. Therefore, in urban digital systems, raster often serves as a base layer or observation layer, while vector is the primary structure for analysis and simulation.
Practical Recommendation: Refer to Japan’s Approach to Basemap Data Development for Rapid Learning
If you need a practical example to visualize what “data infrastructure” looks like, Japan is a case worth studying. In Japan, foundational data and online map services make it easy for users to download and view different data layers, facilitating relatively uniform data access for all stakeholders. At the same time, there are also movements towards building a centralized portal for searching and downloading spatial data from multiple sources. Although each country has different governance structures, the core lesson is clear: without standardized foundational data and a robust enough sharing mechanism, urban digital twins cannot develop sustainably.
Conclusion
Urban digital twins, after all, do not start with 3D, nor do they start with slogans. They begin with digital maps and GIS. That is, from the mindset of data layering, from using basemaps to create context, from the ability for spatial analysis, and from how 3D data is structured with ‘features’ and ‘attributes’. If this foundation is solid, higher layers such as simulation, prediction, and optimization will find their place, and then digital twins will not just be a technological demonstration but a decision-support system.
_If you need urban digital twins, please contact MH&T_