

Urban Digital Twin should not be understood as a 3D model for presentation, but rather as a method for building a ‘digital replica’ capable of describing, analyzing, and supporting data-driven decision-making. However, precisely because of its strong reliance on data, many projects encounter obstacles right from the start: either they access an overly large and complex dataset (many layers, files, structures) but lack classification criteria and processing procedures, leading to an inability to determine a starting point; or they possess a 3D model with high display quality but poor semantics/attributes, making it difficult to reliably serve analytical and simulation tasks.
Therefore, this series is intentionally written in a specific order. First, we will cover how 3D urban data is distributed and used in practice. Next, we will discuss the CityGML structure, as it is a common foundational standard for storing semantic data. After that, the series will delve into LOD, coordinate systems, and conversion processes. By following this path, readers can evaluate data using clear criteria, rather than relying on visual perception.
In this first part, we will answer two seemingly simple questions that can determine the entire project: Where to get data and what data format means.
1) ‘Where to get data?’ is not just about finding a download link
When talking about urban Digital Twin data, many people imagine a single dataset. However, in reality, a digital city is often composed of multiple sources. Each source reflects a different group of information. Therefore, the important question is not where to download, but rather which data directly serves which objective.
Select data according to usage goals
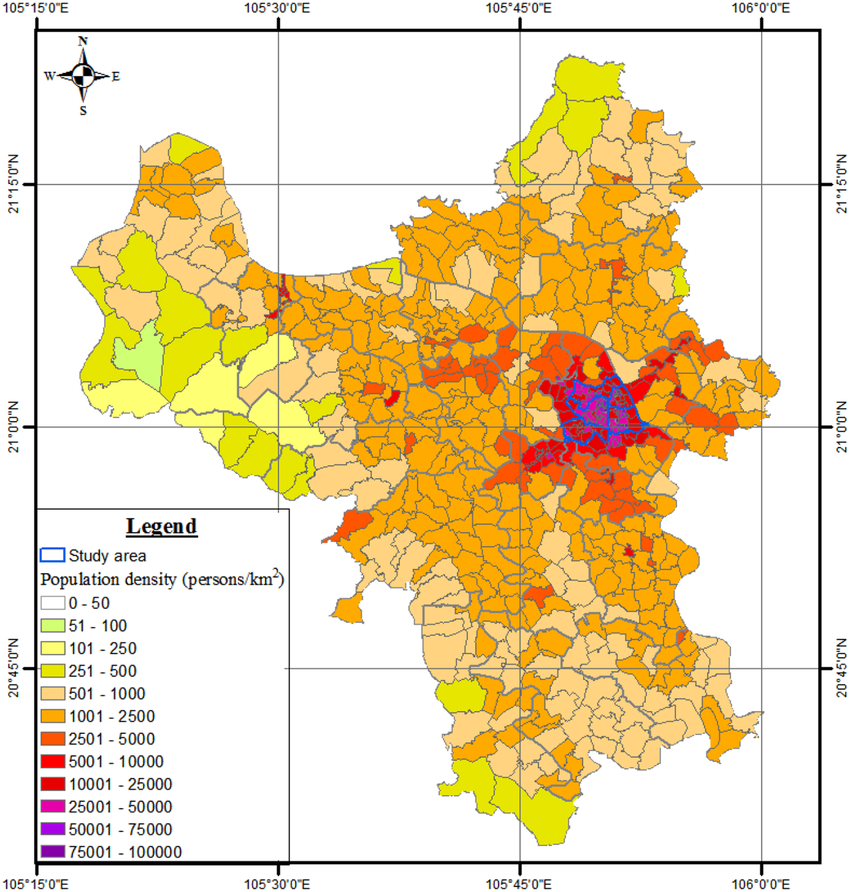
For instance, for urban planning, priority data groups typically include boundaries, land use, indicators, and planning layers. In contrast, for urban operations, the focus shifts to public assets and infrastructure status. Additionally, important data also comprises incident history and sensor data such such as electricity, water, traffic, and environment. If the goal is XR or communication, a 3D model for display will be more crucial. In such cases, user experience is usually the main priority. From this, a principle can be drawn: the usage objective determines the type of data, and subsequently, the data type determines the appropriate format.
Three common data source groups in Vietnam
Firstly, data provided by state agencies, local authorities, or consulting firms. Examples include base maps, planning, and current status data. Secondly, data from businesses and projects. Examples include BIM, as-built documentation, asset management, operational logs, and IoT. Thirdly, open-source and observational data, such as OpenStreetMap, satellite imagery, UAV imagery, and LiDAR. The third group helps create context quickly. However, this group requires quality checks and usage licenses.
Overall, 3D urban data rarely exists as a complete package. Therefore, the appropriate approach is to design a data architecture flexible enough to gradually integrate each part. Concurrently, the project needs to establish criteria for checking and updating from the outset. Without these two factors, the system often becomes difficult to expand and challenging to maintain quality over time.
2) What is CityGML, and why do many countries choose it as a ‘base standard’?

Once you’ve determined the need for a 3D urban model at the data level, you’ll often encounter CityGML. CityGML is an international standard belonging to the OGC standard family. This standard describes 3D urban models as structured data. Technically, CityGML is based on XML, so the content is organized into clear sections, including geometry, objects, and attributes.
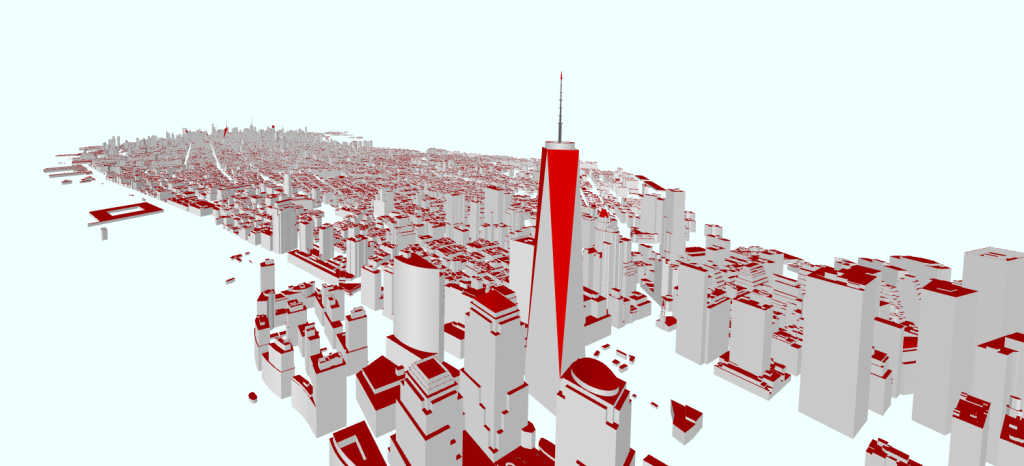
The key aspect of CityGML lies in its semantics. In other words, the data doesn’t just contain building shapes; it also includes information to identify what an object is and to which class it belongs. Concurrently, the data can contain attributes and levels of detail. This makes the model suitable for analysis and simulation.
However, CityGML also has practical drawbacks. Being XML-based and highly structured, files can be large. Furthermore, many common tools do not process it directly and efficiently, especially 3D content tools. Therefore, the discussion of formats becomes crucial right from the implementation phase.
3) ‘Data format’ is not a matter of preference, but of optimization according to objectives
In urban Digital Twin, it’s rare to use just one format. Instead, there’s often a foundational standard format for structured storage. Simultaneously, the system will have multiple deployment formats for each usage context.
For example, CityGML can be considered the foundational format for preserving structure and attributes. However, if the goal is web display, you typically need a tiled format. This method divides data into small pieces and only loads the visible portion, resulting in a smoother experience. Additionally, if the goal is content creation in 3D software or game engines, you’ll need formats suitable for the rendering pipeline. Common examples include OBJ or FBX. And when topographic base maps or orthophotos are needed, you’ll work with georeferenced image formats like GeoTIFF.
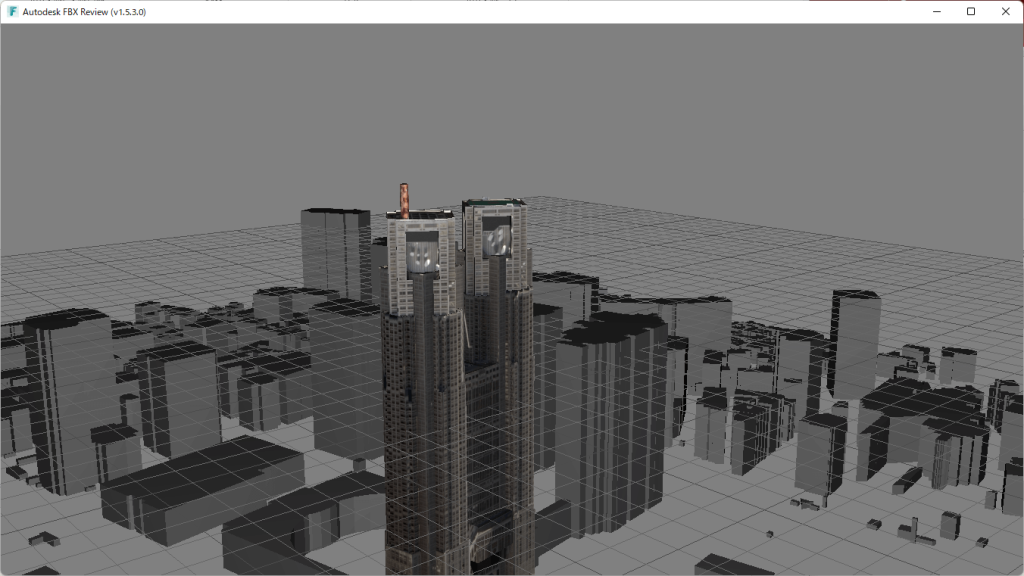
The crucial point is that each format has trade-offs. Formats optimized for display often reduce structure or attributes. Conversely, formats optimized for analysis are usually heavy and require stringent processing procedures. Meanwhile, formats for content production often prioritize surfaces and materials. Therefore, instead of asking which format is best, you should ask which format is suitable for the current stage’s objective.
4) Lessons from Japan: distribution and encouraging on-demand conversion
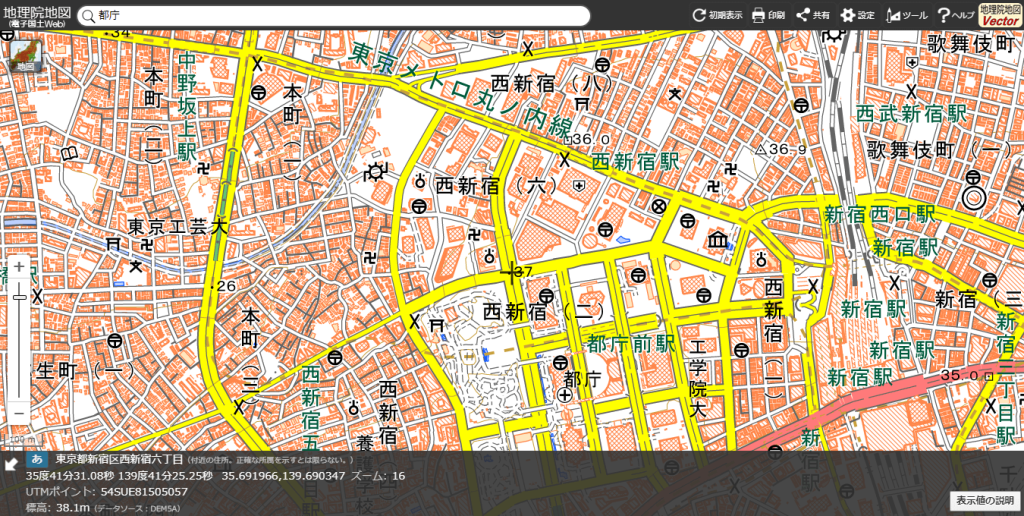
Japan is a noteworthy example. There, 3D urban model data is standardized and distributed through geospatial data portals. The valuable lesson is not just having data, but more importantly, how the data is organized. CityGML is often used as the foundational standard. Additionally, some cities also provide converted versions or supporting data to help users get started faster. When a conversion is not readily available, the common procedure is to filter and clip according to the required scope. Then, the data is converted from CityGML to a format suitable for the deployment tool.
This mindset is also suitable for Vietnam. If one attempts to use a single format for all objectives, projects often face two risks. First, the system becomes too heavy to operate. Second, the data is overly simplified, making it insufficient for analysis. Conversely, by maintaining a structured foundational standard, you can preserve semantics and quality. Simultaneously, conversion branches tailored to objectives such as web, simulation, and content will make the system more flexible.
5) Advice for newcomers in Vietnam: start small, but start right
The most difficult aspect when entering urban Digital Twin is not the lack of tools. The problem often lies in the lack of criteria for selecting data and insufficient verification processes. Therefore, newcomers can start with a simple but consistent logic.
Three quick decision-making steps at the initial stage
First, clearly define the spatial scope, for example, by district, urban area, or infrastructure route. Next, finalize the usage objective, such as visualization for communication or analysis and simulation for decision-making. Once these two factors are clear, the preferred format group will usually become evident. Finally, maintain a reliable source of original data. Regardless of the deployment format, you still need structured original data for updates, verification, and expansion. For cities, data is not just large, but also living; and what strengthens the system over time is not the number of files, but the quality of its structure and its update capability.
Conclusion: Data in the correct format is the foundation of a ‘revenue-generating’ and ‘risk-mitigating’ Digital Twin
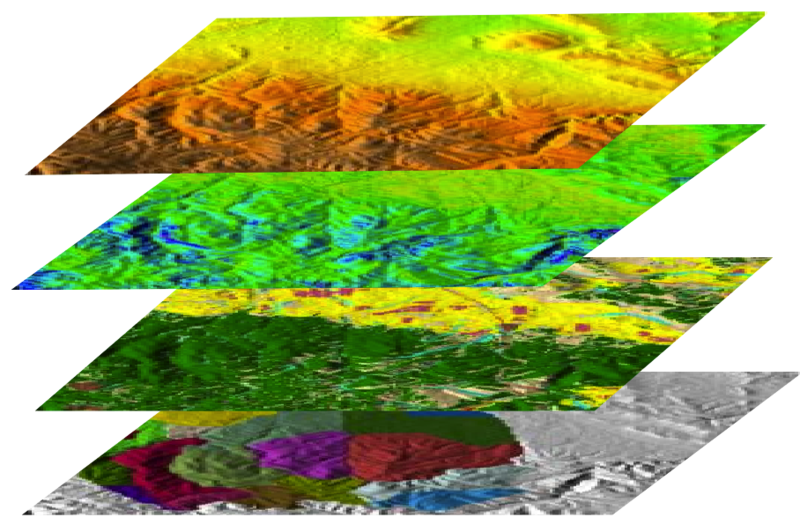
A reliable urban Digital Twin starts with data, not with simulation. First, you need to determine where the data comes from and what its licenses are. Next, you need to check if the data is structured. Finally, you must confirm that the data is suitable for the intended use.
Here, CityGML represents the foundational semantic standard mindset. Meanwhile, conversion formats represent the objective-driven deployment mindset. By combining these two approaches, you avoid two common mistakes: one is creating a visually appealing model that lacks data for analysis, and the other is maintaining overly heavy standard data without a deployment plan.
Once the foundation is correct, the next steps will become clearer. You will find it easier to read data structures. You will also correctly choose LODs and handle coordinates and elevations. Concurrently, you can design a conversion pipeline for stable operation.
Read more in Part 2
In Part 2, we will delve into a question that many project teams encounter: ‘What does CityGML look like internally, and how do you know if your dataset contains the correct objects, attributes, and structure for your problem?’ From there, you will learn how to systematically verify data, instead of just opening the software and hoping ‘it works’.